Decline in exports and imports
Following the fluctuations in Greek foreign trade in the current year, in August 2019 Greek exports declined compared to August 2018, while the course of imports was also down. According to provisional data released today 08.10.2019 by the Hellenic Statistical Authority and processed by the Institute for Export Research and Studies (IEEE) of SEVE, Greek exports stood at € 2,380.2 million in August 2019, against € 2,568.4 million. In August 2018, with a percentage decrease to 7.3% and a corresponding value of € 188.2 million. Imports amounted to € 4.109.2 million marking a decrease of € 217.4 million, ie 5 , 0%, and the trade deficitwas reduced by € 29.2 million, or 1.7%, as presented in Table 1. In contrast, excluding petroleum , the picture is reversed as exports increased by € 40.4 million or 2.6%, imports by € 83.3 million or 2.9% and the trade deficit increased by € 42.9 million, ie 3.2%.
Table 1. External trade of petroleum products in Greece, August 2018/2019
|
(amounts to € million)
|
Aug 19
|
Aug 18
|
Difference 19/ 18
|
ET 19/18
|
|
Exports
|
2,380,2
|
2,568.4
|
-188.2
|
-7.3%
|
|
Imports
|
4.109.2
|
4,326,6
|
-217.4
|
-5.0%
|
|
Trade Balance
|
-1.729.0
|
-1.758.2
|
-29.2
|
-1,7%
|
Source: ELSTAT, Edited by: IESES-SEVE, ET: Annual Trend
The positive is that Greek exports in January-August 2019 are up, as they stood at € 22,411.7 million versus € 21,994.3 million in the eight-month period 2018, with an increase of € 417 , 4 million, or 1.9%. However, there is concern about the excessive increase in imports, which were largely boosted by € 1,459.8 million to € 36,999.7 million, resulting in a worsening trade deficit of € 1.042.4 million. and its formation at € 14,588.0 million.
Table 2. External trade of goods in Greece, January-August 2018/2019
|
(amounts to € million)
|
Jan- Aug 19
|
Jan- Aug 18
|
Difference 19/18
|
ET 19/18
|
|
Exports
|
22.411.7
|
21,994,3
|
417.4
|
1.9%
|
|
Imports
|
36.999.7
|
35,539.9
|
1,459.8
|
4.1%
|
|
Commercial balance
|
-14.588.0
|
-13.545.6
|
1.042.4
|
7.7%
|
Source: ELSTAT, Edited by: IESES-SEVE, ET: Annual Trend
Excluding petroleum products, we note that at the sectoral level , exports of industrial products are declining as they stood at € 3,450.4 million in the first eight months of 2019, compared to € 3,500.7 million in the first eight months of 2018, with a large decline recorded and exports of fats and oils by € 221.7 million, or 45.5%. Significant increase was recorded in exports of various industrial goods by € 388.4 million, and exports of chemicals by € 378.9 million, while exports of raw materials (€ 76.9 million, ie less than positive) were up. 9.3%), machinery-vehicles (€ 76.8m, ie 3.9%), food (€ 30.6m, 1.0%) and beverages and tobacco (€ 27.9m). , ie 6.0%).
Table 3. Exports by industry, petroleum-free, January-August 2018/2019
|
(amounts to € million)
|
Jan- Aug 19
|
Jan- Aug 18
|
Difference 19/18
|
ET 19/18
|
|
Industrial
|
3,450,4
|
3,500,7
|
-50.3
|
-1,4%
|
|
Food
|
3.142.3
|
3.111.7
|
30.6
|
1.0%
|
|
Chemically
|
2,646,1
|
2.267.2
|
378.9
|
16.7%
|
|
Vehicles / Vehicles
|
2,045,5
|
1.968.7
|
76.8
|
3.9%
|
|
Industrial
|
1.848.3
|
1,459.9
|
388.4
|
26.6%
|
|
Raw materials
|
903.3
|
826.4
|
76.9
|
9.3%
|
|
Drinks-Tobacco
|
496.7
|
468.8
|
27.9
|
6.0%
|
|
Fats-Oils
|
265.3
|
487.0
|
-221.7
|
-45.5%
|
Source: ELSTAT, Edited by: IESES-SEVE, ET: Annual Trend
Chart 1. Change in major export sectors, without petroleum products, January-August 2018/2019
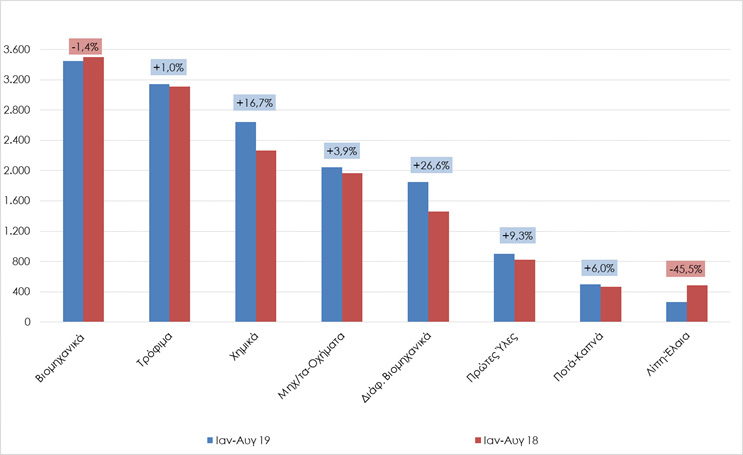
Source: ELSTAT, Edited by: IESES-SEVE
Regarding the sending countries of Greek goods, countries of the European Union are the most important destination in 55.6% and third countries hold a smaller share which stood at 44.4%. The corresponding non-petroleum percentages were 68.3% for the European Union countries and 31.7% for the Third Countries.